MA200 – moving average
All analyses, articles and other information on this website are presented for informational purposes only. None of the content should be interpreted as professional financial advice, investment recommendations or invitations to buy or sell securities. We are not registered as financial advisors under Swedish legislation, and our content therefore does not fall under the rules for financial advice to consumers.
Investment decisions should be based on careful analysis and professional advice from qualified financial experts. We strongly recommend that you consult an independent financial advisor before making important investment decisions. Remember that all investments involve risks - your capital can both grow and decrease in value, and there is no guarantee that you will get back your original investments. Past results say nothing about future returns.
By using this website you accept that we cannot be held responsible for any economic losses or damages that may arise based on the information here.
On this page we recommend some products and services that we like ourselves. It could be books, magazines or online banks (IG, Avanza or Nordnet for example). Sometimes when we recommend something we get a commission and that's how we make money to have resources to keep the site running.
We think it's very important to stand behind what we recommend so the site only contains links to companies and services that we think are really good.

Table of Contents
MA200, short for 200 day moving average, is the most commonly used mean for technical analysis. MA200 = Average exchange rate over the last 200 bars/time units.
It is in the daily graph that MA200 is used the most. In a daily graph, the graph/price curve is updated once per day with a new bar or line. In other words: every unit in the graph corresponds to 1 day.
MA200 as a strategy and signal to trade
Moving averages are used to estimate if a trend is pointing upwards or downwards. It is also used to obtain signals to either buy or sell.
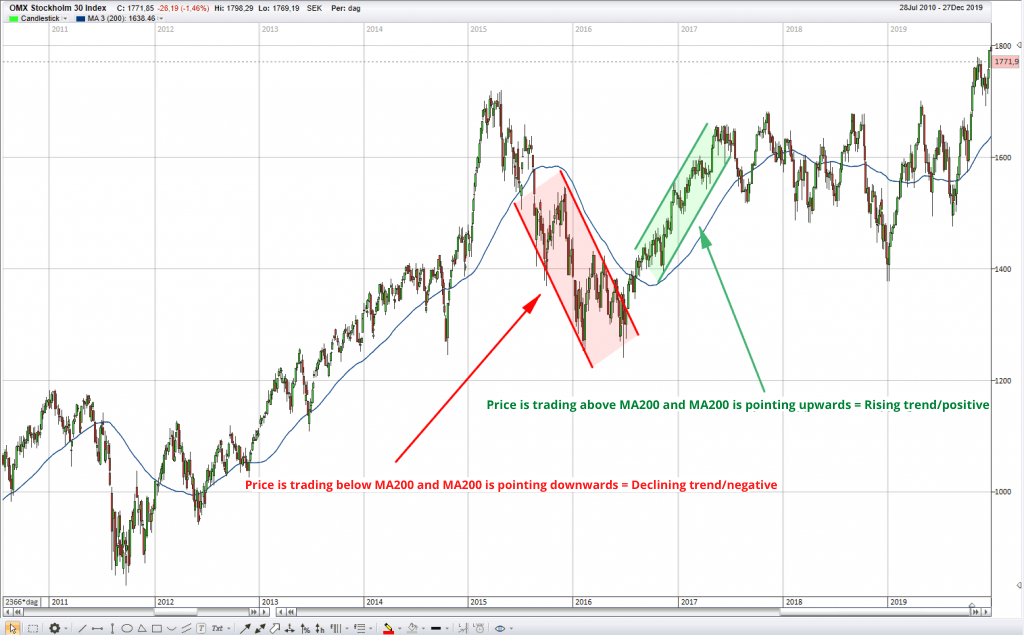
When assessing trends with the help of moving averages, you check if the price is above or below the moving average. You also check if the moving average is pointing upwards or downwards.
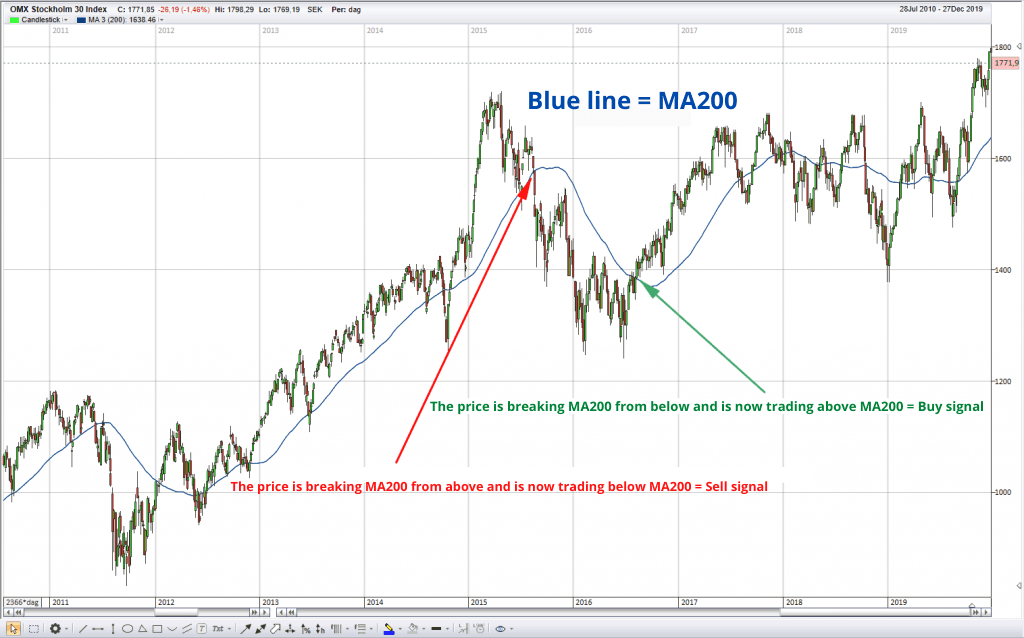
When using moving averages to obtain trade signals you want to find the point when the price breaks above the moving average = buy signal. When the price falls below the moving average = sell signal.
Estimating trends with MA200
- Moving average pointing upwards = rising trend/positive
- Moving average pointing downwards = declining trend/negative
- Price is over and above the moving average = rising trend/positive
- Price is below the moving average = declining trend/negative

Buy and sell signals with MA200
- Price is over and above MA200 = buy
- Price is below MA200 = sell

Death Cross and Golden Cross
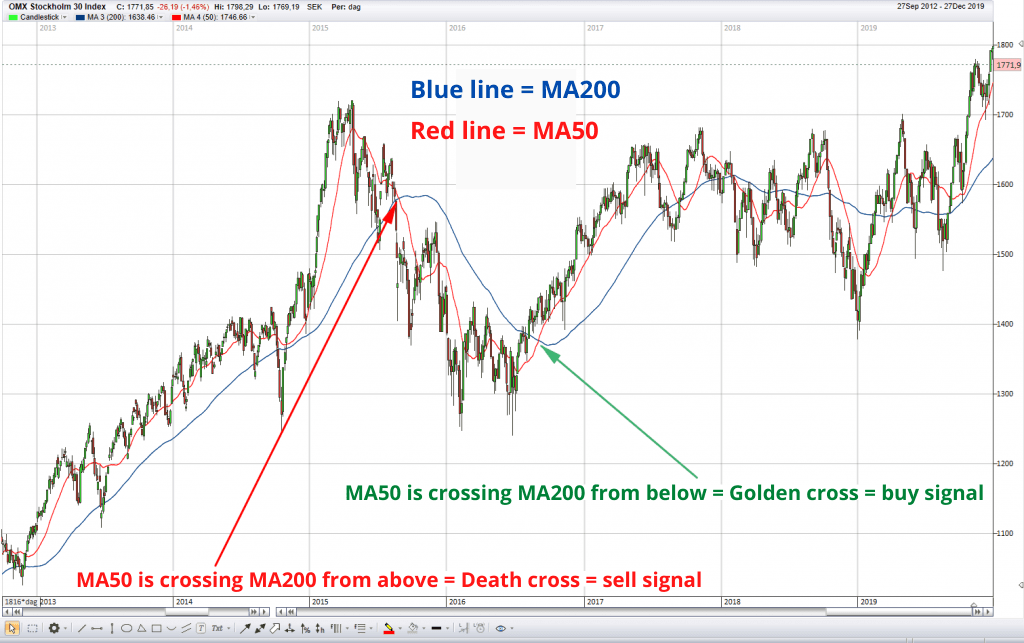
MA200 in the daily graph is also used to obtain buy and sell signals with the help of the so called Death Cross and Golden Cross. In order to find these crosses you must add the MA50 in the graph.
- Golden Cross = MA50 crosses MA200 from below
- Death Cross = MA50 crosses MA200 from above

The explanation behind the Golden Cross is that the short term trend (MA50) starts to point upwards while crossing the long term trend (MA200) from below. This signals that a rising long term trend might be on its way, or has already begun, depending on how MA200 looks currently.
The explanation behind the Death Cross is that the short term trend (MA50) starts to point downwards while crossing the long term trend (MA200) from above. This signals that a declining trend might be on its way, or has already begun. It depends on whether MA200 currently is pointing upwards or downwards.
No comments yet